Workplace Menu
| Return to TBF Workplace | Westchester Program Home Page | Loans, Contributions, and Payments | Reports | Tasks | Instructions for using Reports | List of Links |
Database Program Links
| Westchester Demographic Reports Client Ethnicity | Client Gender | Client Sources of Income |
| Westchester Loan Reports Loans Command Center | Reasons For Arrears | Loan Purposes | Agency Contributions | Loans by Month | Loans and Contributions |
| Westchester Additional Reports Client Services |
Loans, Payments, and Agency Contributions Reports
For explanations of the following reports, go to Westchester Loans, Contributions, and Payments
Links to running these reports:
- Client Loans

- Client Payments for a Loan
- Westchester Loans by Month
- Client and Loan Details by Loan Type Enter Type of Loan/Grant and range of dates the loan or grant was provided. The results show client address, demographic details, household type, household income, family composition, sources of income, and loan details (date, amount, type, purpose of loan or grant).
- Agency Contribution Report
- Loans and Contributions
DemoGraphic Reports
These reports include both a table of results and a graph of the same results. All are grouped by borough or program (such as the Income Growth Project). The data can be downloaded into EXCEL. The chart can be downloaded as an image.
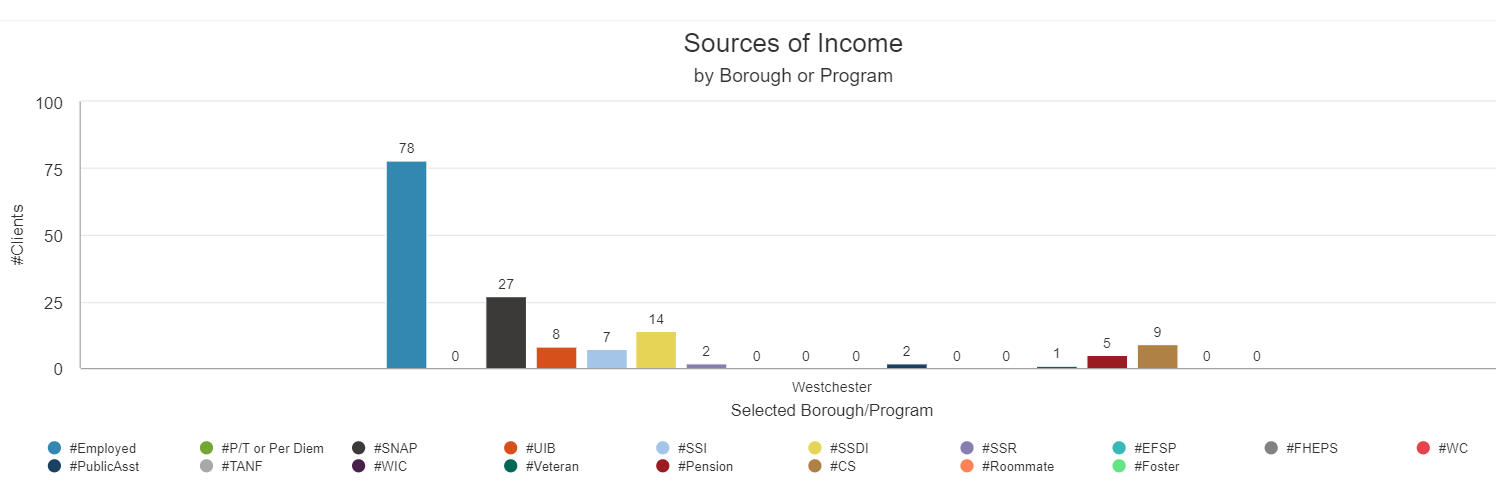
Client Sources of Income Choose Westchester and/or City and see clients’ sources of income displayed in a table and bar graph. Sources of income include Employed, UIB, SNAP, SSDI, etc. Here is a snapshot of the data for New Rochelle. When you actually run the report from the link above, the table can expand to show each client (click on the ” +”).- Clients’ Ethnicity, table and chart Select borough or program, application date (range), status (Accepted, Pending, Rejected, Withdrawn) and Ethnic Group. Or skip some or all choices and see all data. The table below can expand to show each client in each borough (click on the “+”).
- Client Gender Report & Chart Choose Borough or Program, Gender, Date of Application (range) or choose some or none of these. Here is the graph showing gender of client heads of household grouped for Westchester. The table below can expand to show each client (click on the “+”).

