Reports, How to Use
Note: In all report examples, client names have been removed (redacted).
There are two kinds of reports:
- Search and Report on Results
- Report Results based on pre-determined criteria called a FILTER.
Searches
Searches allow you to select the type of information you want in the report. The information you can select depends on the purpose of the report. For example, a report on loans will have search boxes pertaining to Loan Date.
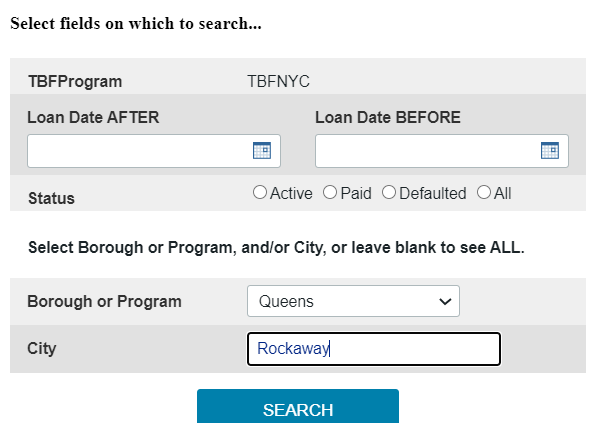
Search boxes are labeled with which field the report will contain, such as First Name, Last Name, ClientID and/or Borough and/or Date. Usually, no entry is required, in which case ALL records will be displayed that contain the search fields. You can also search for any combination of these fields to limit the scope of the report. In the example above, the search will be for ALL loans to Far Rockaway in Queens. (The match to City allows you to enter partial city name). The Date field will have additional information about what date is being used as the criteria: it may be the Acceptance Date or Submission Date (of a form) or Loan Date as shown above. You can search for a range of dates, a date that is AFTER an earlier date and BFORE a later date. For example, to see all the dates in 2017, you would enter AFTER December 31, 2016 and BEFORE January 1, 2018.
The results of the search may appear below the search boxes or on a separate page. If there is a separate page, it will have a link to Search Again.
Filtered Reports
You can’t specify the filter, but the criteria used is explained at the top of the results page. For example, invoice reports may be limited to clients with ACTIVE loans. So the filter would be Status = “A”. If you need reports based on different criteria, you should request that from your Caspio database programmer.
Groups in results
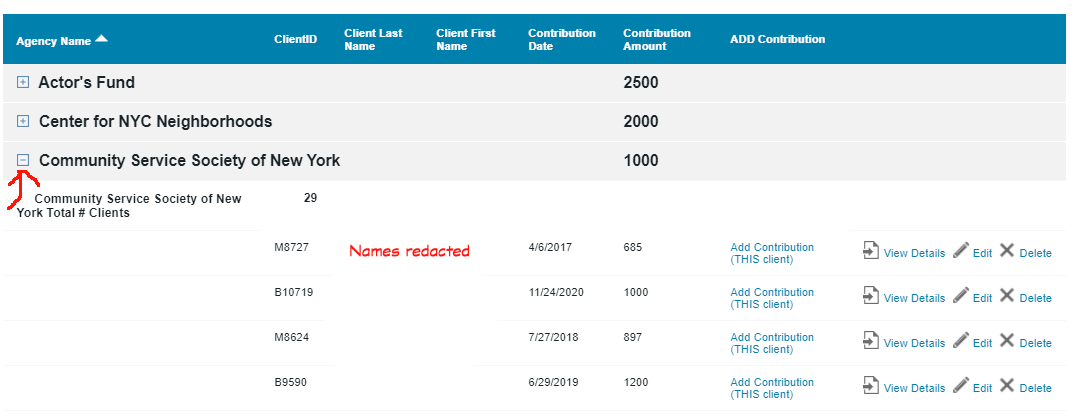
Where there is a lot of data to be totaled, averaged, etc., it can be useful to group the data by, say, borough or date or gender. The reports that use grouping can be shown fully extended, but if you press the little “–” sign, the group collapses to just its totals. Conversely, pressing the little “+” sign, expands the group. In the example below, the first two Agency contributions are “collapsed”; the third is expanded to show their contributions.
Editing Results
Some Results Pages allow you to change the data being displayed. At the end of the row, you will see edit or delete or Details. Or, above the results, you may see Grid Edit which allows you to edit the data in a spreadsheet like format, more than one at a time. The Details link takes you to a separate page with fuller details about that client. For example, here is a portion of the Update Client Details page.
Use the Details link to edit all the information about an individual client (partially shown here):

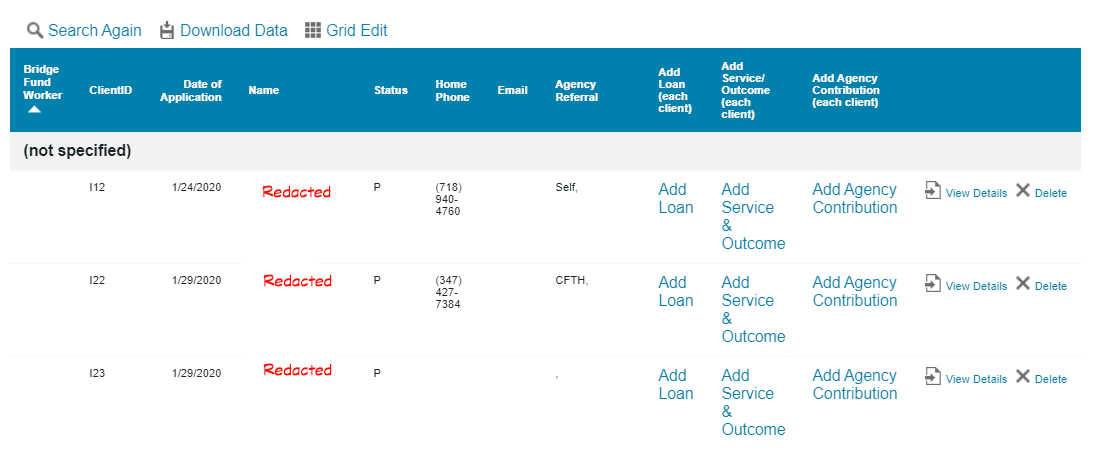
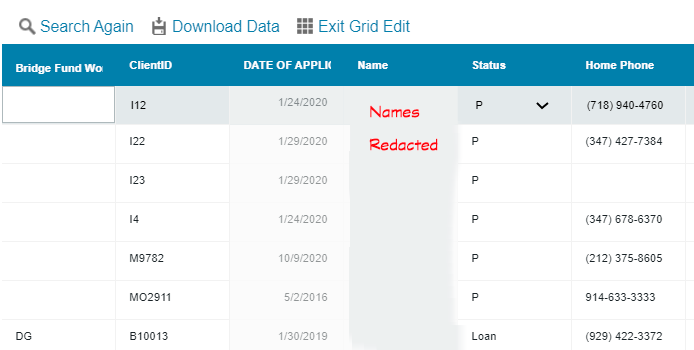
Or, you can use Grid Edit to assign a Bridge Fund worker to each case, change the status, or add phone or email contact information for several clients at once. Here, you see clients not yet assigned a Bridge Fund staff worker, in a Grid Edit View where a worker can be assigned to each:
If you change results or delete results, a notification message will be sent to a manager with all the fields in that record so that if a mistake was made, it can be fixed.
At the bottom of the results, you can set how many records you want on each page. And, you can navigate to the next or previous page. You can click on column headings to sort the information up or down.
At the top of the results, you can Download the Data to a file that can be used by EXCEL. This can be useful if you want to add other calculations such as MEDIAN that EXCEL has, but Caspio does not have (yet). MEDIAN is useful for Median Rent or Median Income; it is better than AVERAGE which can be distorted by outliers.
If a report is very wide, you will see a scrollbar at the bottom. Very wide reports have also been designed to keep the first couple of columns fixed, so that when you scroll, they stay in place and the other columns scroll, preserving your view of the ClientID, name, etc.
Reports with Charts
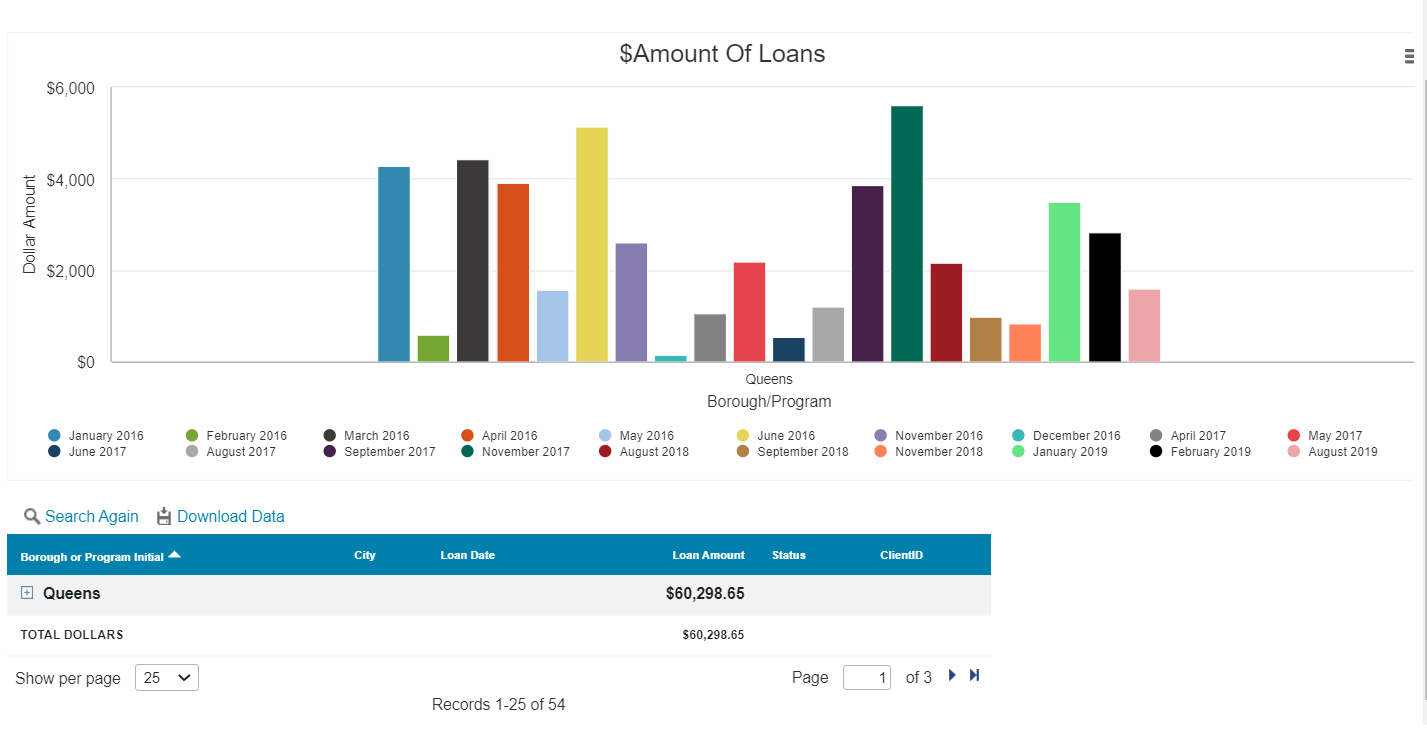
Some reports include a chart above or below the results. In the upper right corner of the chart is a menu button that enables you to download just the chart as a png or jpg graphic file for use in a report. The X-axis will show how the data has been grouped, such as by ethnicity or dates. Dates may be shown grouped into months or years or month and year. Remember the Search Box at the top of this page? Here is the chart of Loans to Far Rockaway in Queens:
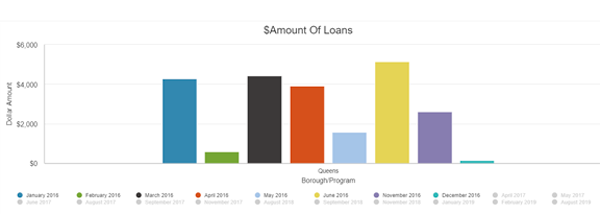
Note the chart above, the table of results below. Now, suppose you decide you just want to see a chart of loans in the year 2016. If you click on every month on the X-Axis that is in another year, that data will be hidden on the chart. Those month labels are grayed-out as shown here:
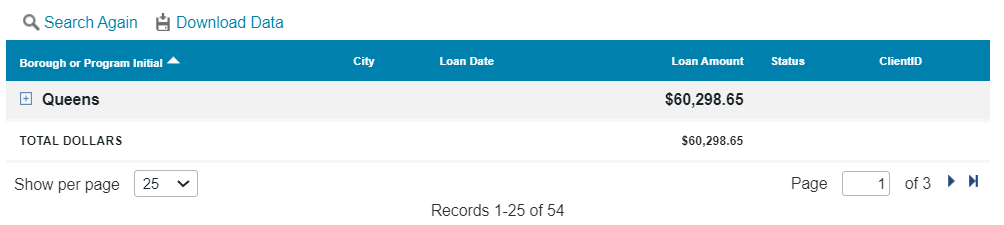
Now let’s look at the table below the chart.
 g
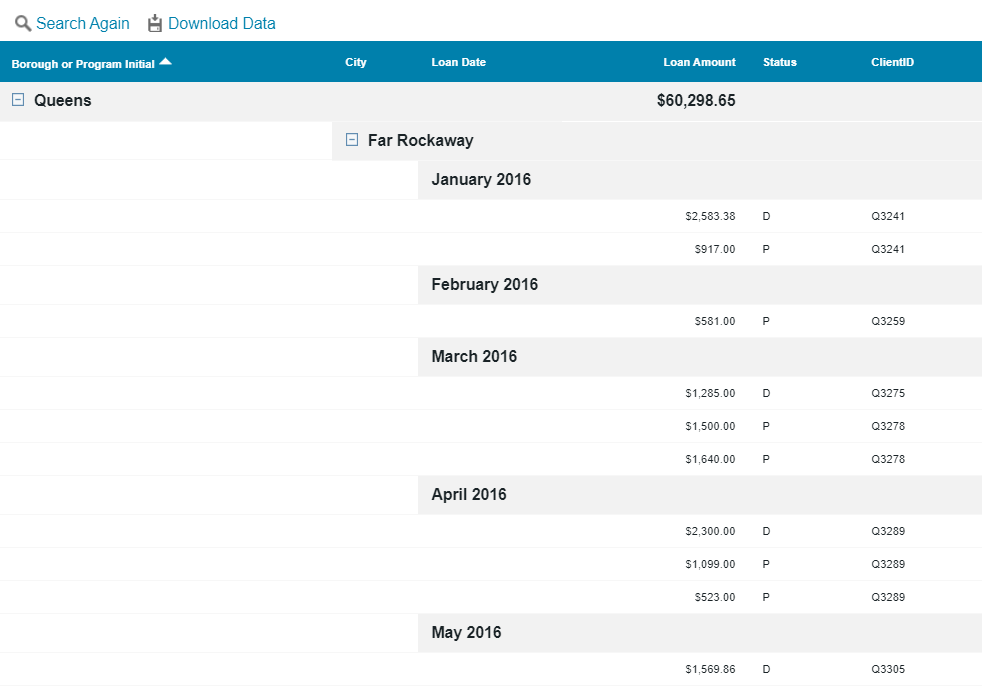
gNote that you can see the total amount of loans to Far Rockaway, and that you can advance to the next page of table data (there are three pages altogether), and set the number of data records per page. Here, that is set to 25, but you can go up to 250 data records per page. You can download the data, or Search again. Note that changing the number of months on the x-axis of the chart does not change the number of data records shown in the table; that was determined in the initial search box.
If you click on the “+” sign next to Queens, you will see Far Rockaway, also with a “+” sign. Click on that to expand all of Far Rockaway’s loans, and you see the details for each loan (only some of them are shown here).: